Sea Level Changes
Extract from the book: The Post-Glacial Hypothesis
If our ‘flooded Britain’ hypothesis is correct, we should be able to get verification via the empirical evidence of sea level changes to see if it has been constant over the last 12,500 years. Most scientists and historians when talking about the end of the LGM, refer people to the phenomenon called the ‘Meltwater Pulses’ to prove that the exchange from frozen glaciers to today’s landscape was rapid. (Sea Level Changes)

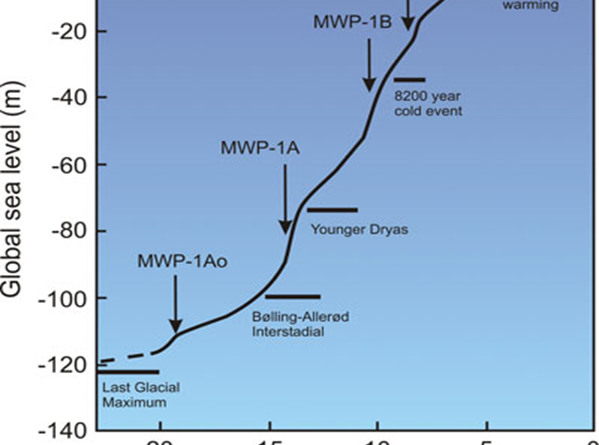
| Figure 6.. Generalized sea level rise since the last ice age showing several meltwater pulses (MWP). MWP-1A0, c. 19,600-18,800 years ago; MWP-1A, 14,600 to 13,800 years ago; MWP-1B, 11,000-8,800 years ago; and MWP-1C, ~8,200-7,600 years ago. © Nasa model. |
The first significant increase in sea levels was (meltwater pulse 1Ao, or MWP 1Ao), 19,600-18,800 years ago, ocean levels climbed at least 10m within 800 years. However, not all sea-level proxies register this event.
A faster rise began 14,600 years ago during the comparatively mild Bølling-Allerød interstadial, which accelerated about 300 years later and peaked about 13,800 years ago (meltwater pulse 1A, or MWP 1A) (Stanford et al., 2011). Although it is a tremendous 20m surge in height, it should be recognised that this ‘pulse’ as only 16% of the total sea rise since the end of the LGM.
Computer models that “fingerprint” spatial patterns of sea-level rise attribute much of the meltwater to Antarctica. Different sources of ice melt leave geographically distinctive sea-level fingerprints because their ice unloading histories and the gravitational pull between shrinking ice masses and oceans vary.
On the other hand, geological data indicate significant deglaciation in Antarctica starting only toward the end of MWP 1A, which suggests that most of the meltwater originated from the breakup of Northern Hemisphere ice sheets. (Sea Level Changes)
During the Younger Dryas cold period, between 12,900 and 11,800 years ago, the encroaching oceans slowed their upward pace. A massive freshwater influx via the Mackenzie River into the Arctic Sea and ultimately the eastern North Atlantic may have triggered this cold episode. Once the warmth returned, rates of sea-level rise averaged 13 to 15 mm/yr during meltwater pulse 1B, 11,000-9,000 years ago, an event recorded in Barbados, but not in Pacific corals. This difference may arise from glacial isostatic or gravitational effects; alternatively, the increase at Barbados may have been overestimated.
Around 9,300 years ago, a glacial dam burst at the south-eastern end of Lake Superior, provoking pervasive Northern Hemisphere cooling, followed by a minor meltwater pulse about 9,000 years ago. However, meltwater pulse 1C (8,200-7,600 years ago) left traces at numerous locations in the United States, north-western Europe, and China.
Most glacial melting ended by about 7,000-6,000 years ago.
Because of slowly diminishing adjustments of Earth’s lithosphere to ice sheet removal, sea level falls near formerly ice-covered regions and rises along the margins of the vanished ice sheets. (Kemp et al., 2011). This ‘conveyor belt’ carries warm water from the tropics (represented by red arrows) into the North Atlantic. There, the water cools and sinks before flowing back toward the south (yellow arrows). This pattern of circulation plays a vital role in regulating climate in the North Atlantic as well as the rest of the world. (Sea Level Changes)
More information on Sea Level Changes can be found at: https://youtu.be/j5LJ2sGcKOA (Sea Level Changes)
Further Reading
For information about British Prehistory, visit www.prehistoric-britain.co.uk for the most extensive archaeology blogs and investigations collection, including modern LiDAR reports. This site also includes extracts and articles from the Robert John Langdon Trilogy about Britain in the Prehistoric period, including titles such as The Stonehenge Enigma, Dawn of the Lost Civilisation and the ultimate proof of Post Glacial Flooding and the landscape we see today.
Robert John Langdon has also created a YouTube web channel with over 100 investigations and video documentaries to support his classic trilogy (Prehistoric Britain). He has also released a collection of strange coincidences that he calls ‘13 Things that Don’t Make Sense in History’ and his recent discovery of a lost Stone Avenue at Avebury in Wiltshire called ‘Silbury Avenue – the Lost Stone Avenue’.
Langdon has also produced a series of ‘shorts’, which are extracts from his main body of books:
For active discussions on the findings of the TRILOGY and recent LiDAR investigations that are published on our WEBSITE, you can join our and leave a message or join the debate on our Facebook Group
(Sea Level Changes)


