Landscape Transformation (raised river levels)
Extracts from the book: The Post Glacial Flooding Hypothesis
When we put all the information about the Holocene together including the vast amounts of meltwater, Ice melt pulses, raised water table and increased precipitation, then we are left with evidence of increased water activity, volume and consequential raised river levels levels of the Holocene.

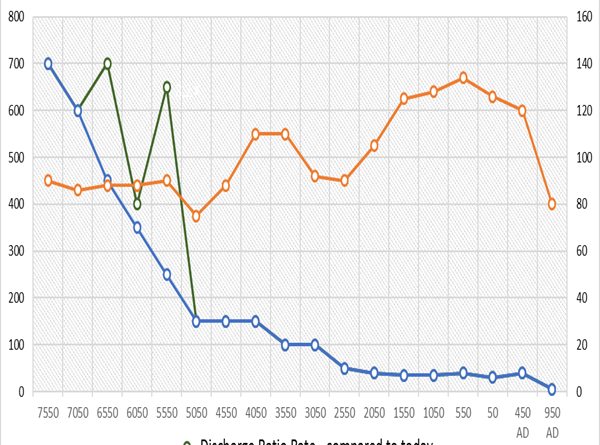
Figure 14. Shows the Discharge rates into the Wadden Sea for the last ten thousand years – see below for statistical details of the graph. We have ‘smoothed’ the pulses (in green) to show the steady drop of river discharge (in blue) since the last ice age.
Table 3 – Wadden Sea statistics
| BCE | Change (mm) over – 500 years | Discharge Ratio rate – compared to today = 1 | Adjusted Ratio for Discharge – Pulses | Precipitation levels mm pa |
| 950 AD | 50 | 1 | 1 | 450 |
| 450 AD | 400 | 8 | 8 | 430 |
| 50 | 300 | 6 | 6 | 440 |
| 550 | 400 | 8 | 8 | 440 |
| 1050 | 350 | 7 | 7 | 450 |
| 1550 | 350 | 7 | 7 | 375 |
| 2050 | 400 | 8 | 8 | 440 |
| 2550 | 500 | 10 | 10 | 550 |
| 3050 | 1000 | 20 | 20 | 550 |
| 3550 | 1000 | 20 | 20 | 460 |
| 4050 | 1500 | 30 | 30 | 450 |
| 4550 | 1500 | 30 | 30 | 525 |
| 5050 | 1500 | 30 | 30 | 625 |
| 5550 | 6500 | 130 * | 50 | 640 |
| 6050 | 4000 | 80 | 70 | 670 |
| 6550 | 7000 | 140 * | 90 | 630 |
| 7050 | 6000 | 120 | 120 | 600 |
| 7550 | 7000 | 140 | 140 | 400 |
* Meltwater Pulse – see figure 8.
We have added the increased precipitation (in yellow) during this period to indicate the reasons for the river flooding events we will show in the following sections.
Therefore the blue ‘discharge’ line on the graph is an indication of the volume discharge and hence the size and height of rivers over the last ten thousand years – the chart uses today’s discharge rate (950 AD) representing one unit, to give us a simple visual comparison to previous years as a ratio of size – hence 8050 BCE the rivers were 140 times larger than today.
More information on raised river levels can be found at:https://youtu.be/j5LJ2sGcKOA
Further Reading
For information about British Prehistory, visit www.prehistoric-britain.co.uk for the most extensive archaeology blogs and investigations collection, including modern LiDAR reports. This site also includes extracts and articles from the Robert John Langdon Trilogy about Britain in the Prehistoric period, including titles such as The Stonehenge Enigma, Dawn of the Lost Civilisation and the ultimate proof of Post Glacial Flooding and the landscape we see today.
Robert John Langdon has also created a YouTube web channel with over 100 investigations and video documentaries to support his classic trilogy (Prehistoric Britain). He has also released a collection of strange coincidences that he calls ‘13 Things that Don’t Make Sense in History’ and his recent discovery of a lost Stone Avenue at Avebury in Wiltshire called ‘Silbury Avenue – the Lost Stone Avenue’.
Langdon has also produced a series of ‘shorts’, which are extracts from his main body of books:
For active discussions on the findings of the TRILOGY and recent LiDAR investigations that are published on our WEBSITE, you can join our and leave a message or join the debate on our Facebook Group.
A Glimpse into the Robert John Langdon Trilogy
Step into the shoes of Robert John Langdon, a dedicated explorer of Britain’s prehistoric mysteries. His trilogy, comprising “The Stonehenge Enigma,” “Dawn of the Lost Civilization,” and “The Post-Glacial Flooding Hypothesis,” is a literary marvel that unravels the untold tales of our ancestors. These books take you on an exhilarating journey through time, meticulously researched and backed by over 125 references from esteemed scientists, archaeological experts, and geological researchers.


